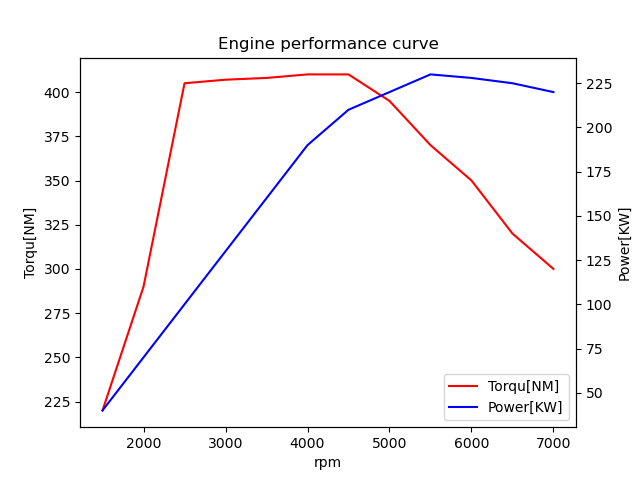
PythonnoMatplotlibで左右に目盛のある2軸グラフを描きたい方、この記事ではMatplotlibを使った2軸グラフをエンジンの性能曲線[横軸回転数(rpm),縦軸トルク(NM),縦軸パワー(KW)]を作成しながら解説します.

上の図のような2軸グラフを作成します.いきなり2軸グラフを作成するのではなく以下のステップで作成して行きます.
・以下の手順で進めます
(1)トルク曲線作成
(2)POWER曲線作成
(3)2軸グラフへ変換[エンジンの性能曲線]
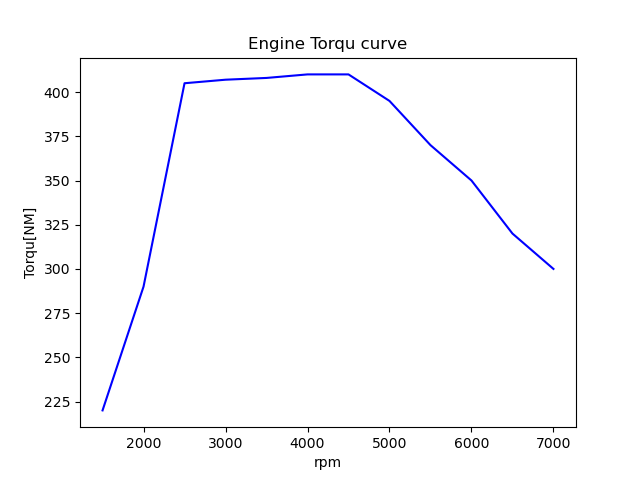
(1)トルク曲線の作成(元グラフ)
トルク曲線を折れ線グラフで作成していきます.
import matplotlib.pyplot as plt
fig = plt.figure()
ax1 = fig.add_subplot()
x1 = [1500,2000,2500,3000,3500,4000,4500,5000,5500,6000,6500,7000]
y1 = [ 220, 290, 405, 407, 408, 410, 410, 395, 370, 350, 320, 300]
ax1.plot(x1, y1,color = "blue", label = "Torqu[NM]")
ax1.set_title("Engine Torqu curve")    #タイトル
ax1.set_xlabel("rpm")  #x軸ラベル
ax1.set_ylabel("Torqu[NM]")  #y軸ラベル
plt.show()
ごく普通の折れ線グラフが完成しました.
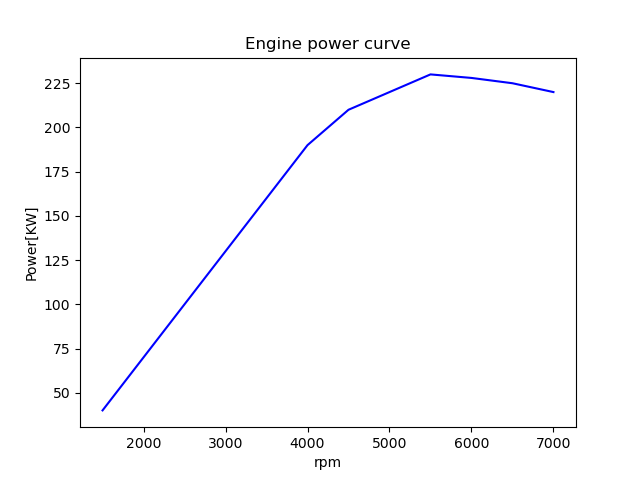
(2)POWER曲線の作成(追加グラフ)
グラフをax2としてPOWER曲線を作成していきます.
import matplotlib.pyplot as plt
fig = plt.figure()
ax2 = fig.add_subplot()
x1 = [1500,2000,2500,3000,3500,4000,4500,5000,5500,6000,6500,7000]
y2 = [  40,  70, 100, 130, 160, 190, 210, 220, 230, 228, 225, 220]
ax2.plot(x1, y2,color = "blue", label = "Power[KW]")
ax2.set_title("Engine power curve")    #タイトル
ax2.set_xlabel("rpm")  #x軸ラベル
ax2.set_ylabel("Power[KW]")  #y軸ラベル
plt.show()
追加する折れ線グラフの完成です
(3)2軸グラフへ変換[エンジンの性能曲線]
(1)ax1のオブジェクトをax2オブジェクトに関連付けさせます.(ax2はax1の横軸がなく縦軸が反転したオブジェクトになります.)
ax2 = ax1.twinx()
(2)元のax1グラフにax2グラフを描くために足りない部分を追加します.
(3)Axes.twinx()を使うと凡例が離れたり重なって表示されます。ax1とax2の凡例を結合する必要があり,以下の様に記載すると1つの凡例でax1とax2を記載できます.
h1, l1 = ax1.get_legend_handles_labels()
h2, l2 = ax2.get_legend_handles_labels()
ax1.legend(h1+h2, l1+l2 )
import numpy as np
import matplotlib.pyplot as plt
fig = plt.figure()
ax1 = fig.add_subplot()

ax2 = ax1.twinx()  #ax1のオブジェクトをax2オブジェクトに関連付け

x1 = [1500,2000,2500,3000,3500,4000,4500,5000,5500,6000,6500,7000]
y1 = [ 220, 290, 405, 407, 408, 410, 410, 395, 370, 350, 320, 300]
y2 = [  40,  70, 100, 130, 160, 190, 210, 220, 230, 228, 225, 220]
ax1.plot(x1, y1,color = "red", label = "Torqu[NM]")
ax2.plot(x1, y2,color = "blue", label = "Power[KW]")

ax1.set_title("Engine performance curve")    #タイトル
ax1.set_xlabel("rpm")  #x軸ラベル
ax1.set_ylabel("Torqu[NM]")  #y1軸ラベル
ax2.set_ylabel("Power[KW]")  #y2軸ラベル

#凡例
h1, l1 = ax1.get_legend_handles_labels()
h2, l2 = ax2.get_legend_handles_labels()
ax1.legend(h1+h2, l1+l2 ,loc='lower right')
plt.show()
これで自動車のカタログで見るエンジン性能曲線ができました.慣れれば2軸グラフを初めっから描くこともできますが,しばらく使ってないとすぐに忘れたり,データの取り扱いが解らなくなったりします.こんな時はグラフを2つ別々に作成してから2軸グラフを作成すると良いと思います.
スポンサーリンク


コメント