
解析等のポスト処理でParaviewを始めて使う方や不慣れな方のために、Paraviewで結果を表示させるために最低限必要な機能だけに絞って手順を解析しております.主に結果表示、カラーバーの設定、時刻表示、結果断面表示を取り扱ってます。
スポンサーリンク
ファイル読み込み
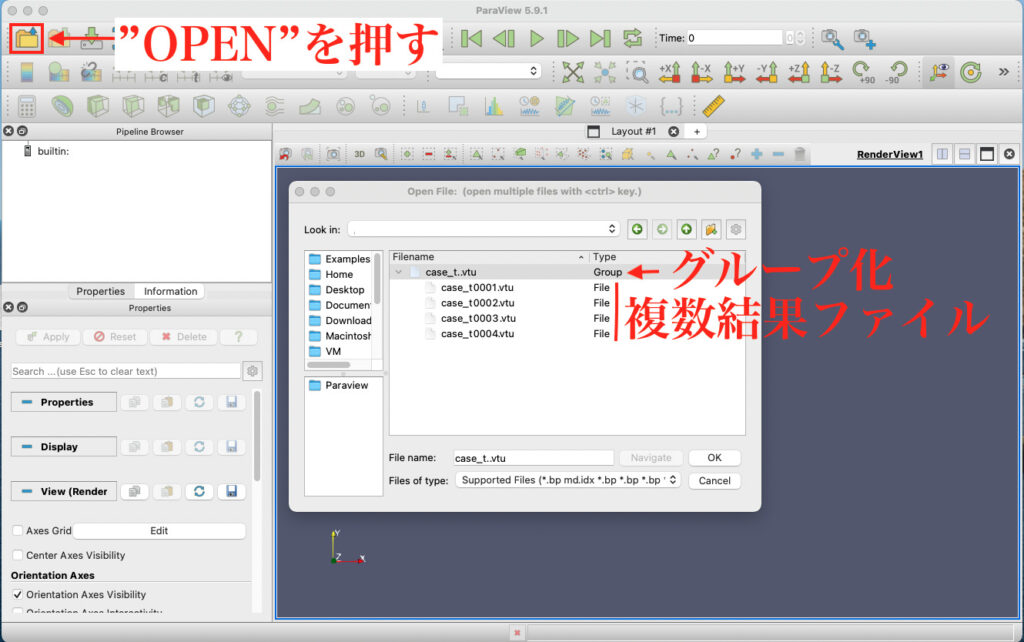
・Paraviewを起動した状態で”OPNE”のアイコンを押し、開いたフォームから結果ファイル(vtk,vtu) を選択します。時系列データが複数ある場合はグループ化され1つにまとめられます。
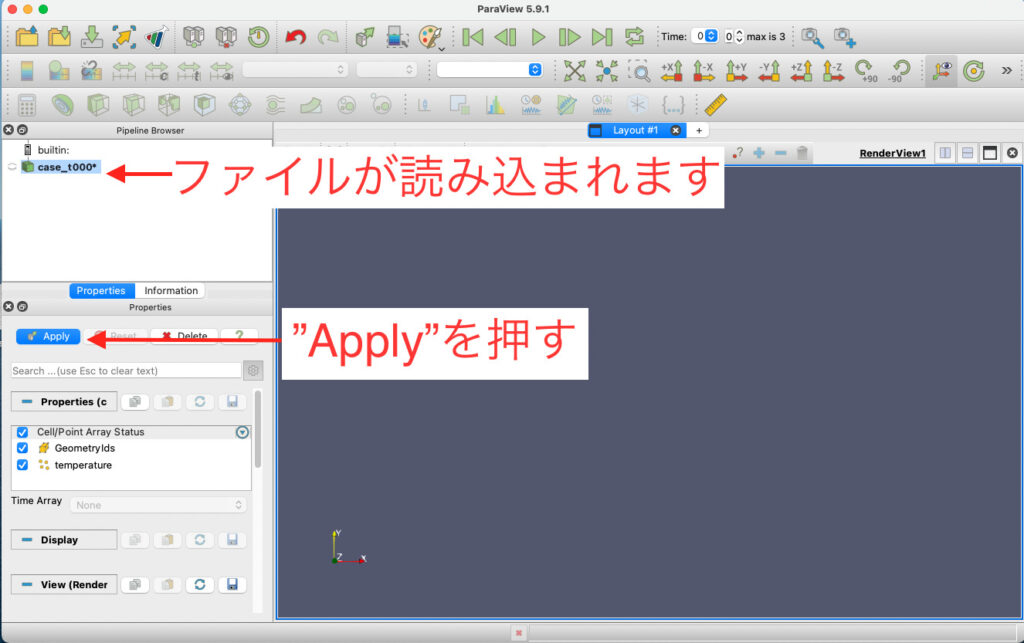
・読み込んだファイル名の前にある目のアイコンが閉じておりこれはモデルが非表示状態を表しています。”Apply”を押して操作するモデルを確定します。
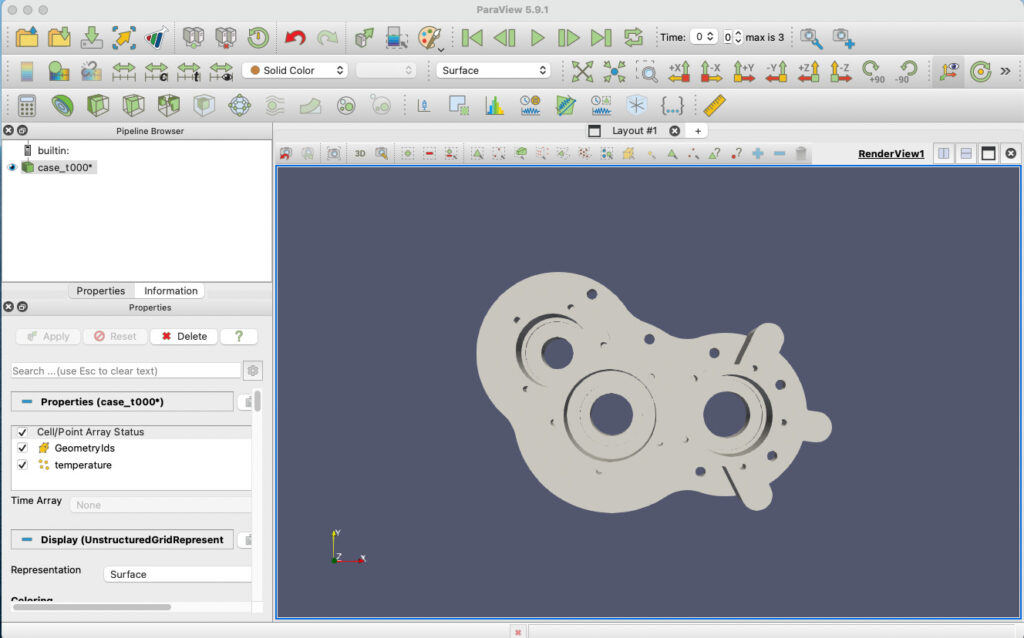
・モデルが読み込まれ表示されました.
モデル操作
・モデルの操作はマウスから行います.
回転: マウス左を押しながらマウスを動かします.
移動: マウスの真ん中を押しながらマウスを動かします.
拡大縮小: マウス右を押しながらマウスを動かします.
結果選択
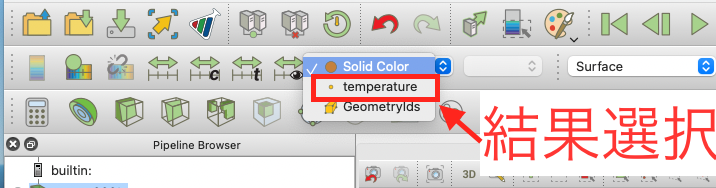
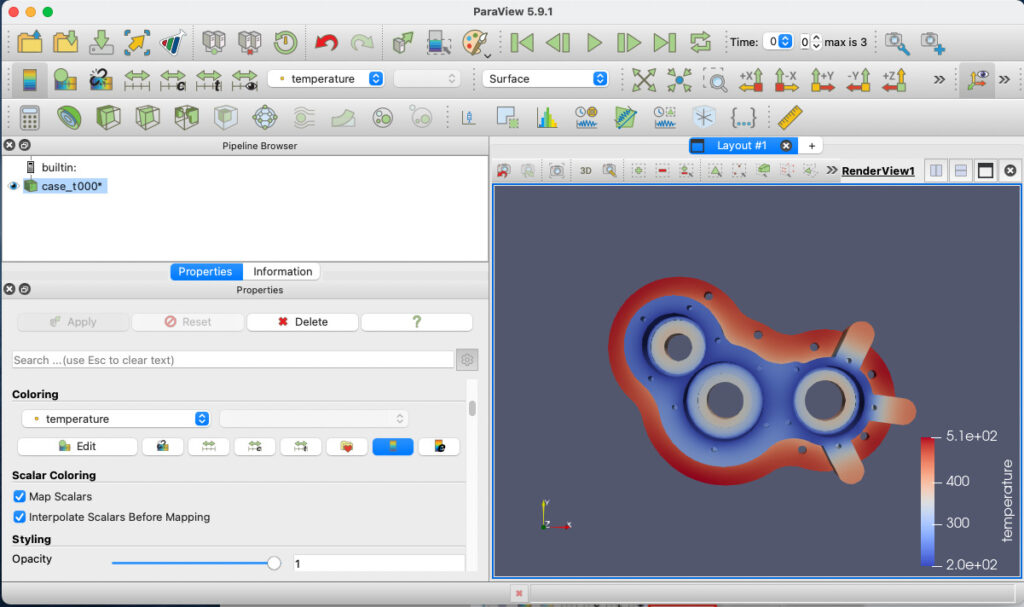
・“Solid Color”と表示されている部分を選択して表示したい結果を選択してください.ここでは“temperature”を選択しました.
・指定した結果が表示されました.
カラーバーの設定
・カラーバーの設定は左下の“Properties”フォームより行います。
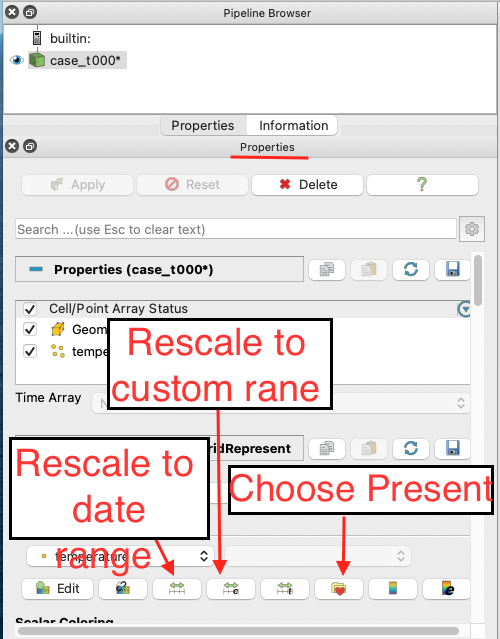
・結果のデータ範囲から自動スケール
“Rescale to data range”アイコンを押します.(デフォルト)
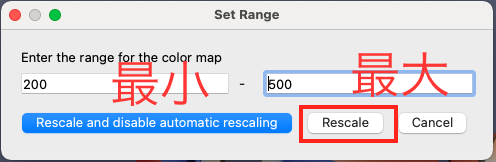
・カラーバーの範囲を設定することができます.
”Rescalae to custom range”アイコンを押し、レンジの最小 最大を入力して、“Rescale”ボタンを押します.
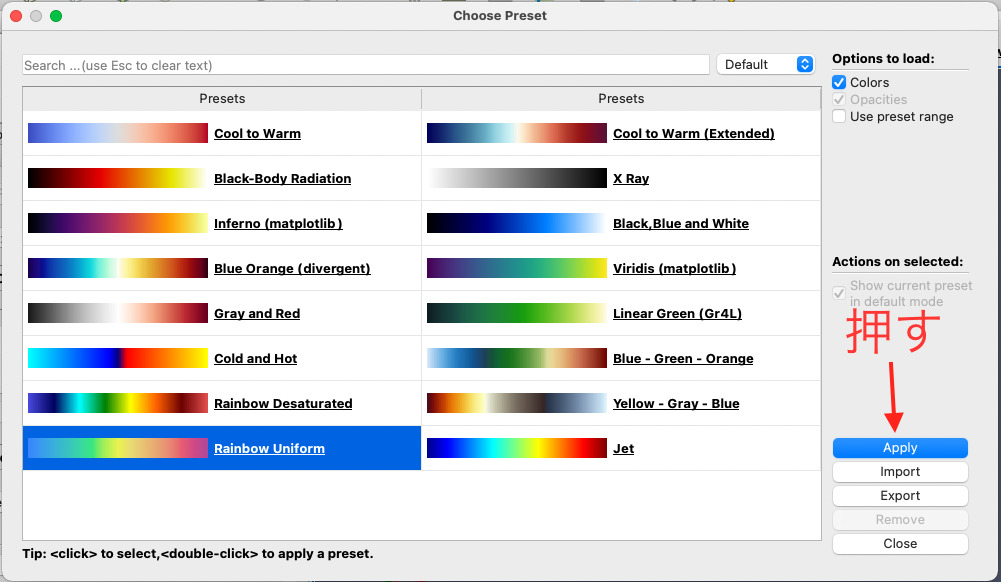
・カラーマップの変更
”Choose Present ”アイコンを押して、開いたフォームから変更したいカラーマップを選択して”Apply”を選択しフォームを閉じます.
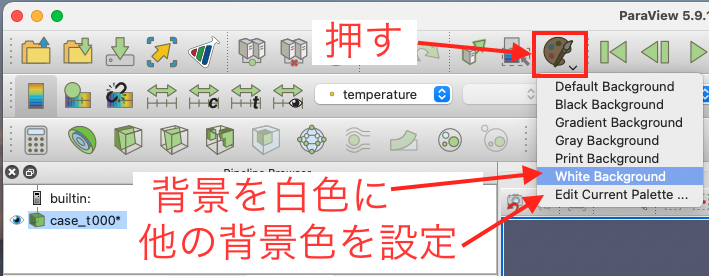
背景色の変更
・”Load a color patten”のアイコンを押して、背景にしたい色をプルダウンメニューより選択します.
ここでは”White Back Ground”を選択しております.プルダウンメニューに希望のが無い場合は”Edit Current Pallet”より選択します.
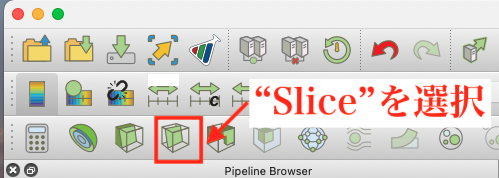
結果を断面を表示する
・”Slice”を選択
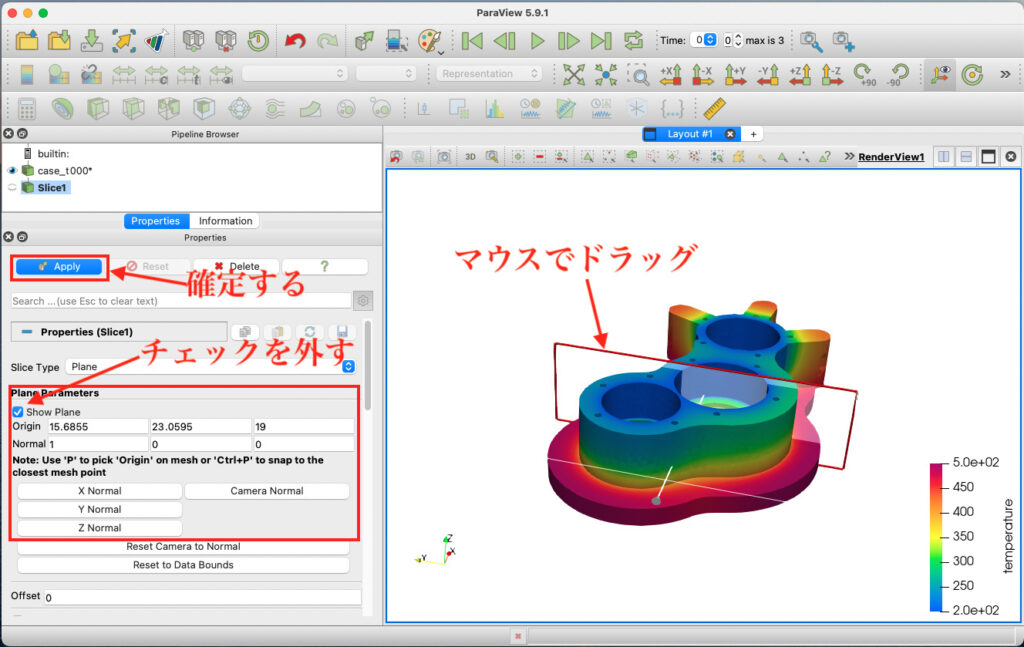
・結果を作成する断面の位置を決めます
モデル上で断面をドラッグして移動させたり、断面の方向を変えることができます.
また、”Plane Parameters”の”original”からsliceの原点と”Normal”から法線の値を決めます.X,Y,Zの各法線はNormalボタンより選択することができます.
・断面位置が決まったら、“Show Plane”のチェックを外し断面を非表示にします.
”Apply”ボタン押して確定します.
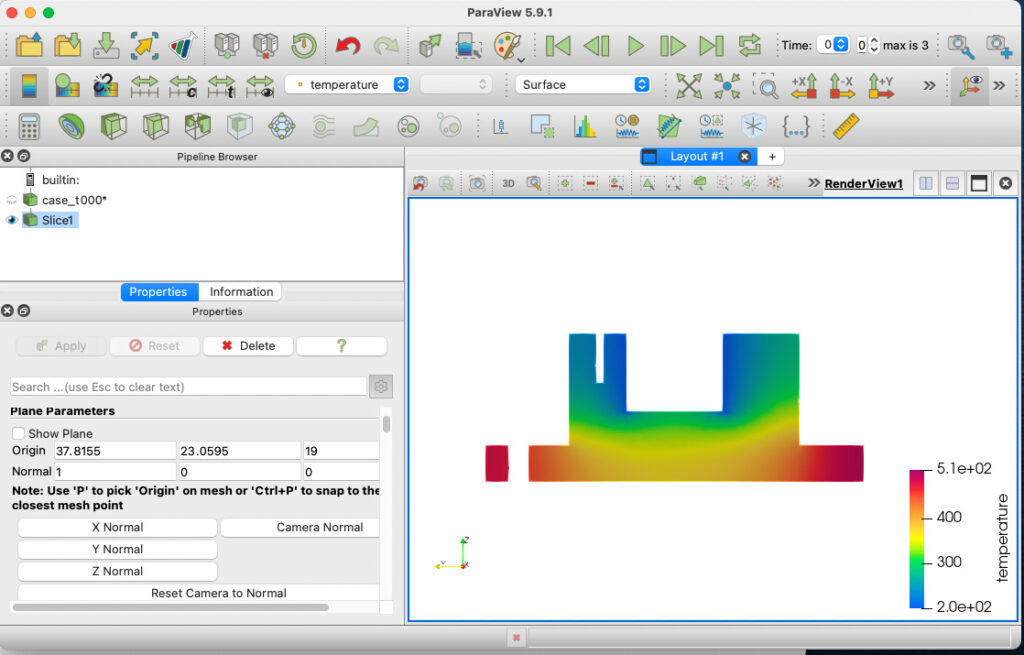
・断面結果が表示されました.
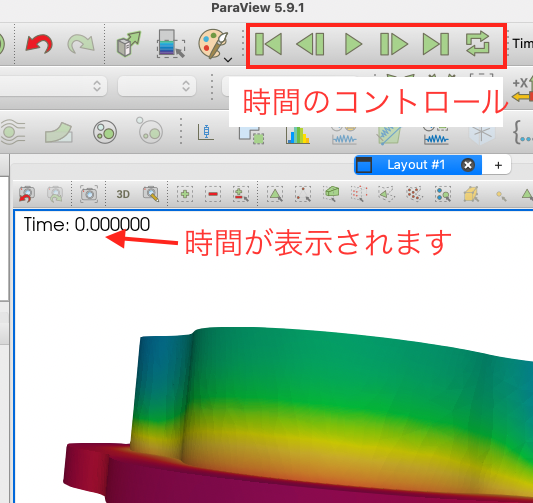
時間表示
データが複数ある場合には、時刻を表示させることができます.データ内に時刻情報がある場合とユーザーが指定する場合で設定の方法が異なります.
データ内に時間情報がある場合の設定
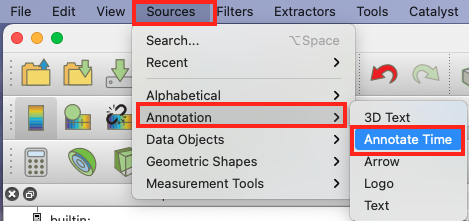
source > Annotation >Annotation Time の順に選択します.
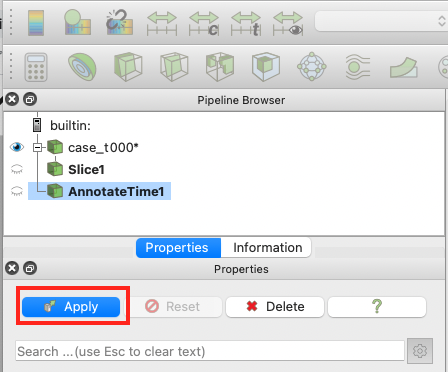
“Apply”を押します.モデル画面にTime表示が現れます.
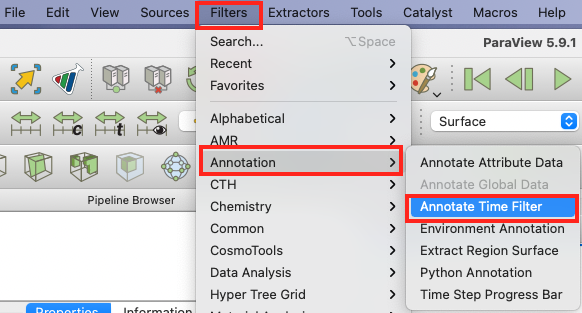
時間の開始と増分をユーザが設定する場合
Filters >Annotation TimeFilterの順に選択します.
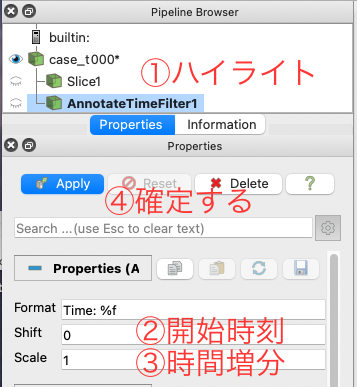
①“Pipeline Browser”フォームから”Annotation TimeFilter”を選択してハイライトします.
②shift :開始時刻
③scale: 時間増分
④“Apply”を選択します.
・時間が表示されました。ビデオコントロールパネルで結果を時間を次に進めたりします.
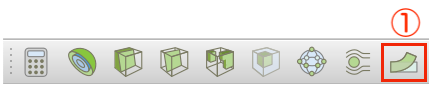
変形を誇張して表示
モデルの変形が小さいケースではどこが変形しているか判らないことがあります.変形倍率を大きくして表示することが”Warping buy Vector”よりできます.(変形結果を持っていることが必要です)
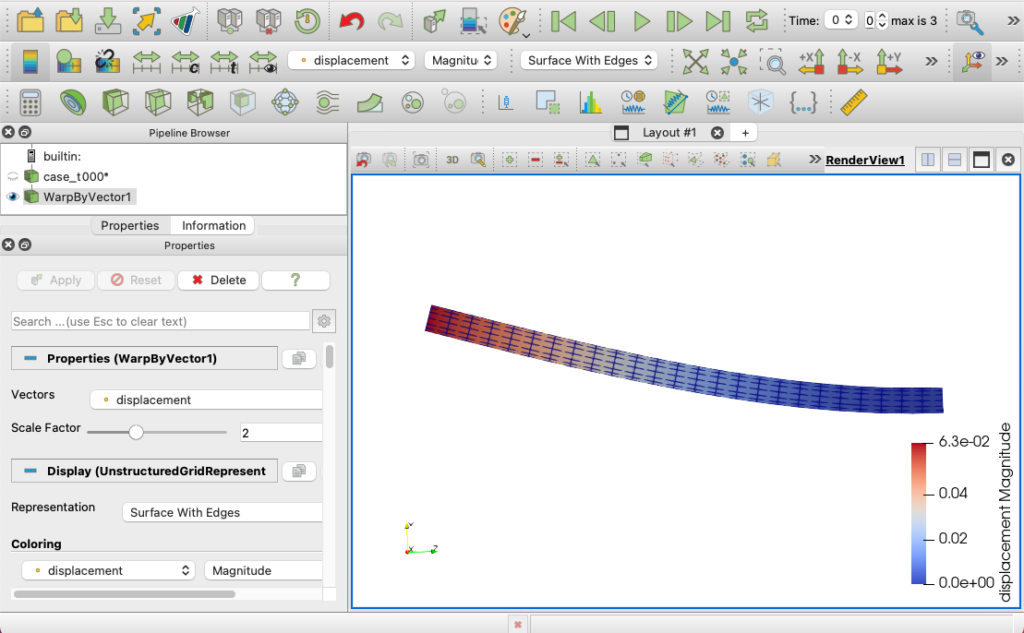
①”Warping buy Vector”を選択します.
②”Scale Factor”に拡大倍率を入れます.
③”Apply”で確定します.
・拡大変形させると誇張して変形が分かりやすくなります.
ここまでで、Paraviewの操作ができるようになったのではないかと思います.
Paraviewの関連記事も参考にどうぞ

コメント